Infographics Project
Information graphics or infographics are graphic visual representations of information, data or knowledge intended to present information quickly and clearly.- Information is important - Infographics are not charts: Visuals are so much more powerful than text and numbers.
- Visual Data - Data is more interesting when its visual: Our brains process visual information faster and more easily than text, and visual information is 650% more likely to be remembered by your audience than text alone
- Avoid Legends - remove chart legends: Legends that are separate from the visualization of the data make your readers work much harder, looking back and forth between the data and the legend, to understand your visualization.
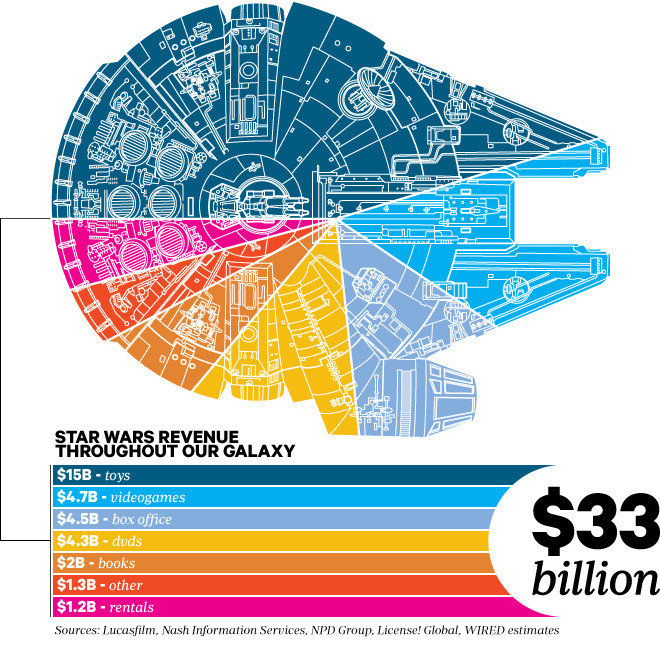
Poor Examples of Infographics:
Why are these examples uninteresting?


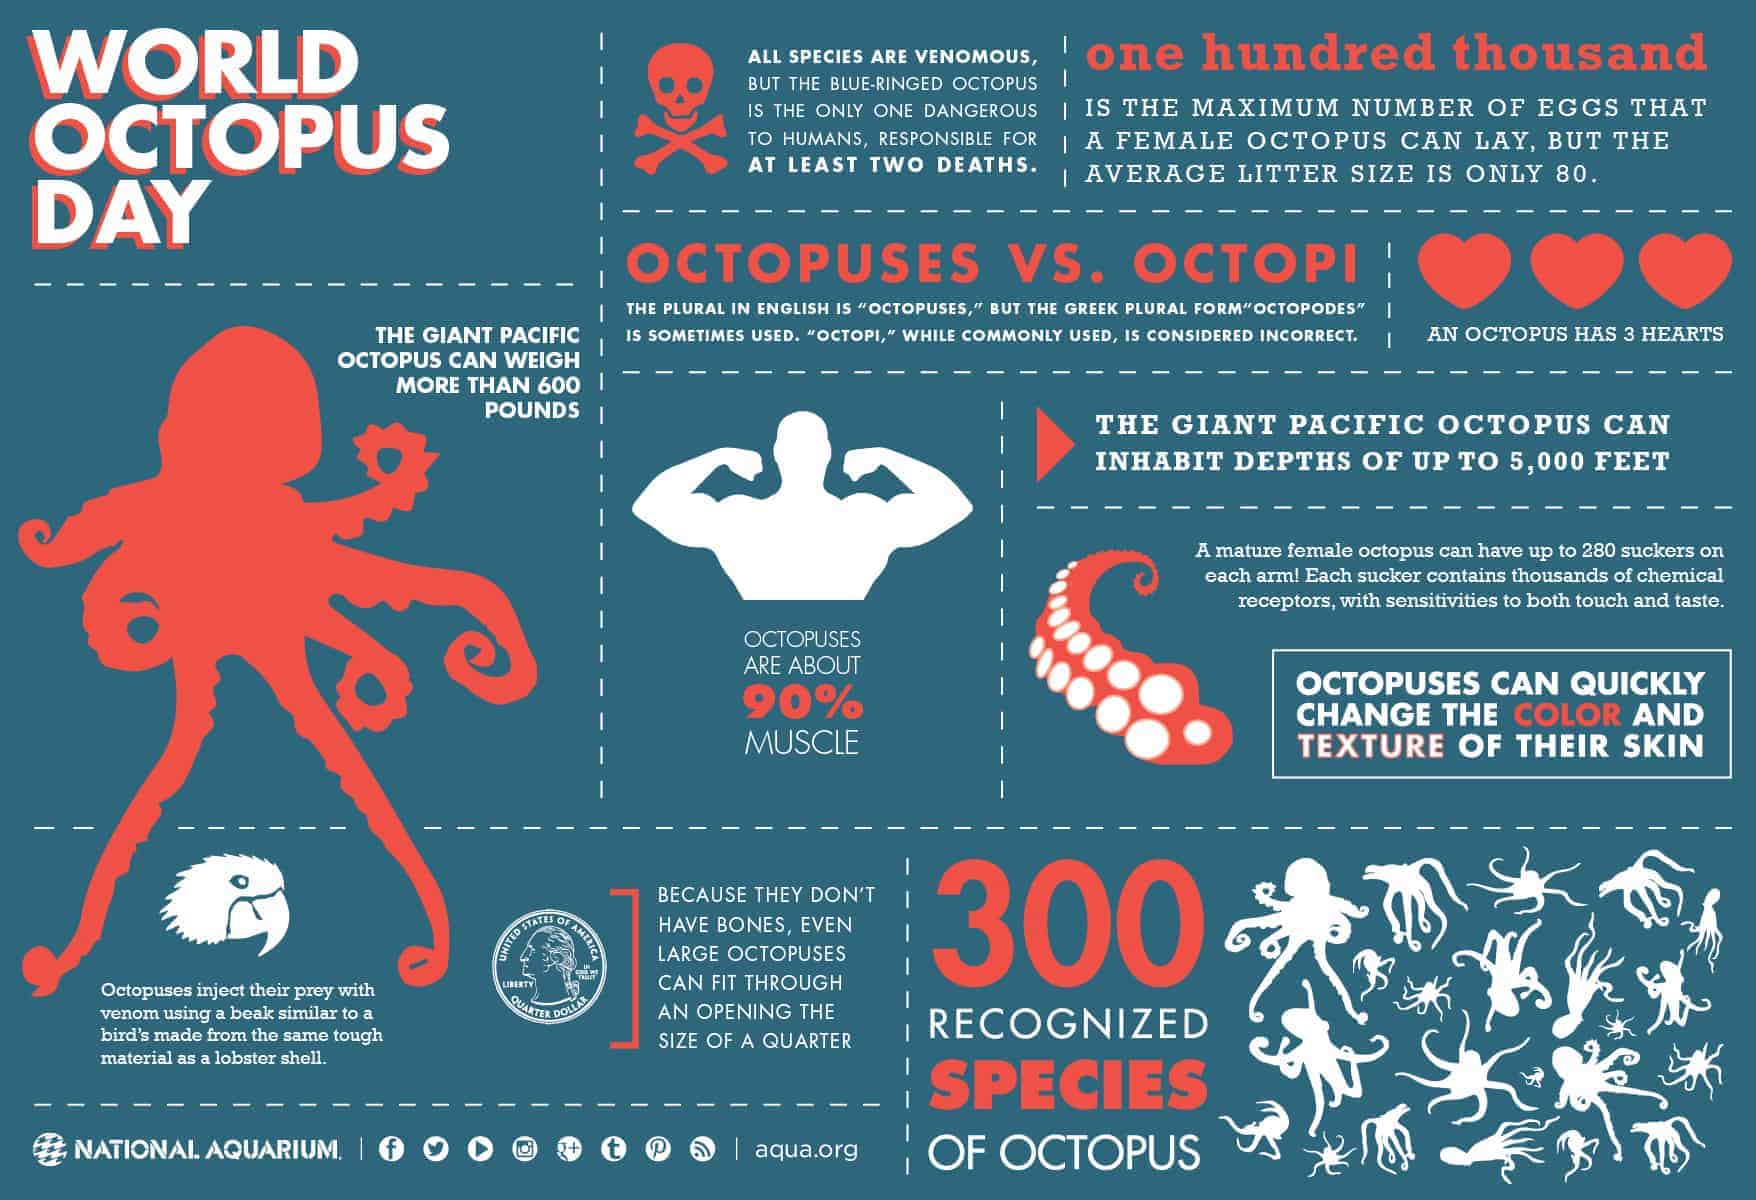
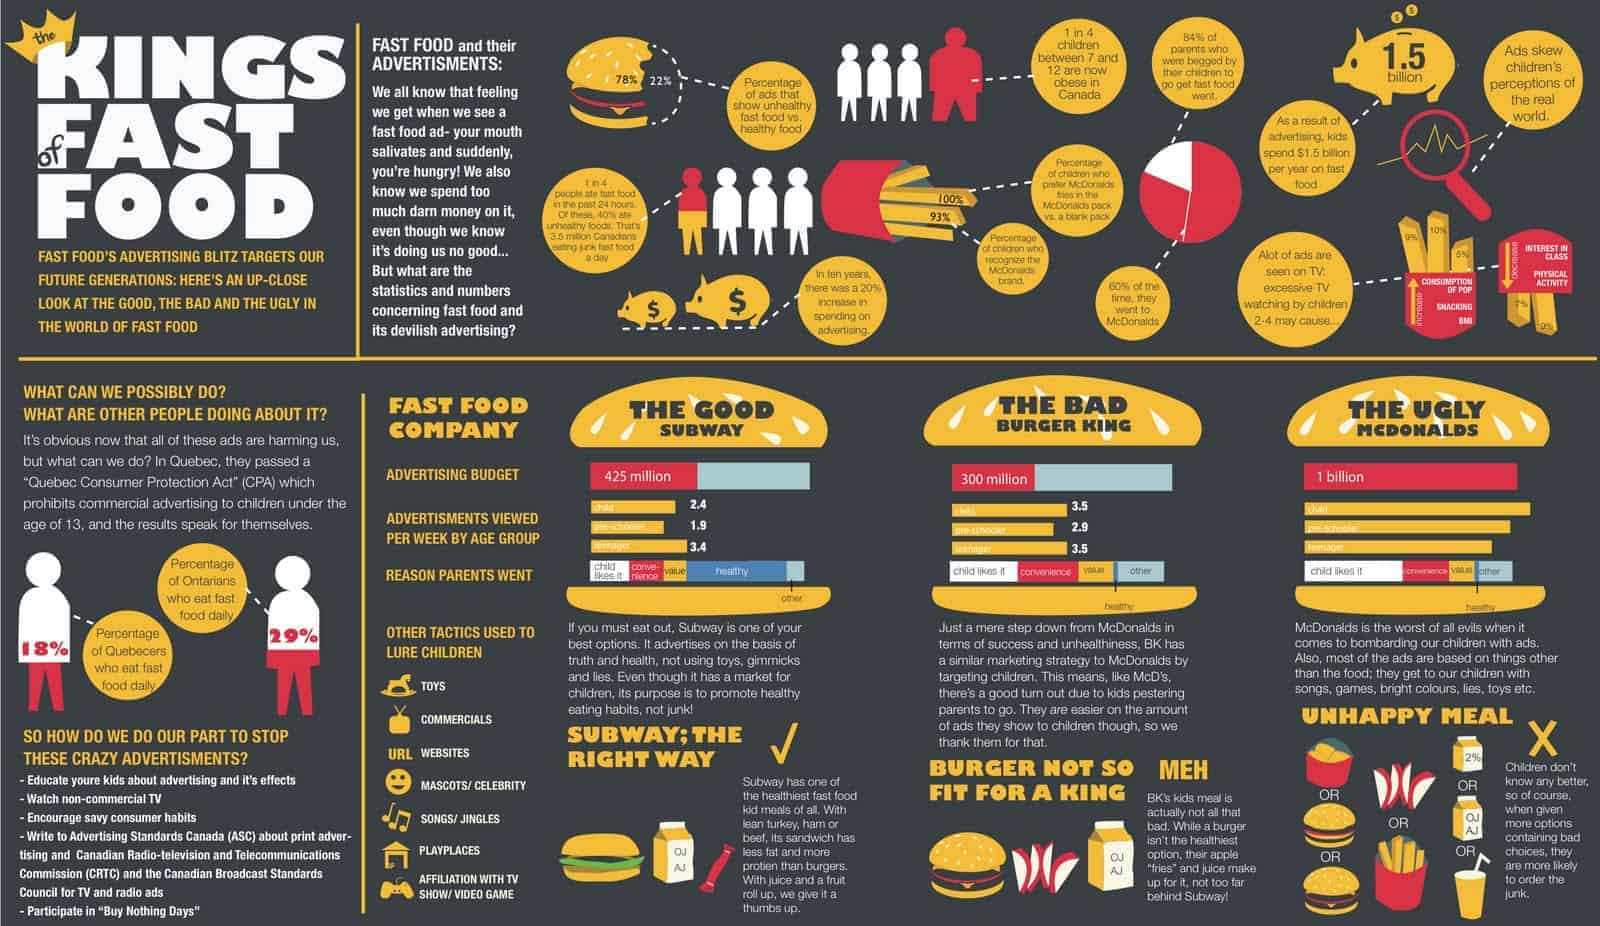
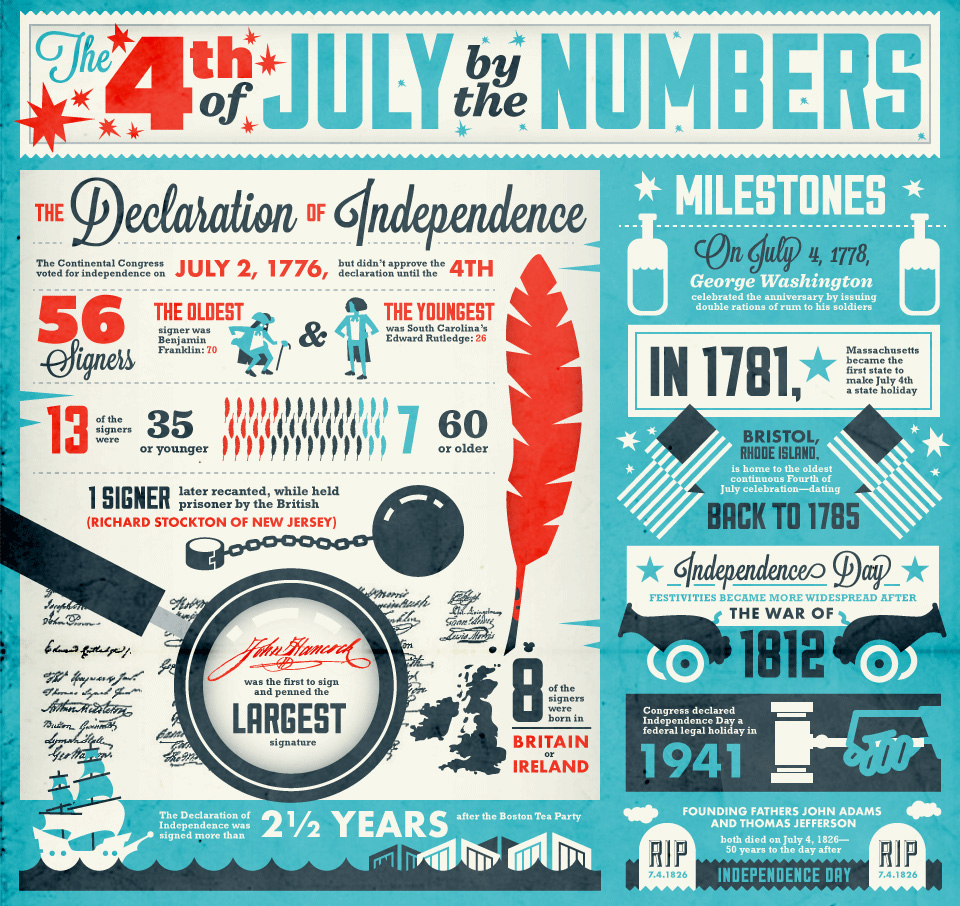
Why are these better?


Infographics Project Prompt
Steps and Tips
- Think about ways to visualize data. Think about what the data represents? Why is the information important? How can you get a viewer's attention?
- Develop a topic or research question. What is important to you? What information can you find to inform other people? Why should they care about this information?
- Draft your infographic (sketch by hand or in PhotoShop)
- In Illustrator use tools, techniques and effects to begin designing your infographic.
- Think about color scheme (Illustrator comes with preloaded schemes). How can you make the graphic dramatic using colors?
- KISS - "keep it simple suckah" Minimalism is key to clarity.
- Arrange the infographic in a way that makes sense. Think about the inverted pyramid (top having the most information and the bottom having the single most important idea).
- Include citations
Choosing a Topic
Choosing a topic that is important to you is key to a successful infographic. Think about something that you know or want to know more about. Then think about ideas that you want to inform others about. Are there political, social, entertainment, or other topics that you find yourself "teaching" others about?
Some sample topics:
- Should students be allowed to have phones in school?
- Should college athletes be paid for playing?
- Should high school students have to complete community service hours to graduate?
- Should students be paid for having good grades?
- Should teens be able to buy violent video games?
- Should immigration laws be reformed?
- Should school athletes have to be on the honor roll to play in games?
- Should people who download music and movies illegally be punished?
- Should music with curse words be allowed at school functions or the school day?
- Should public schools begin the day with a silent prayer time?
- Should cities offer free public Wi-Fi?
- Should the government place a tax on junk food and fatty snacks?
- Should people have to get a license to become parents?
- Should abortions be legal in cases of rape and incest?
- Should the death penalty be used to punish violent criminals?
- Should schools start later in the morning?
- Should students learn about world religions in public schools?
- Should students who commit cyber-bullying be suspended from school?
- Should art be a mandatory subject to graduate high school?
- Should there be less core classes and more elective courses?
- Should you where white before labor day?
- Should hiphop artists be censored when they are sexist? Racist? Advocates for violence?
- Should we have a "black lives matter" movement?
- Should LGBT people have special rights? Should they be allowed to get married? Adopt children?
Finding Information
- Take a side - choose for or against.
- Look for information that supports your argument.
- Look for information that does not support argument (counters it).
- Think about how you can represent this information - look at infographics online as inspiration.
- Start with data (numbers, percents, quantities) at the top.
- Add levels of information that build towards your final statement.
- End with your final statement > use your most prominent art graphic.
Sample Infographics


Find your own!
Project Requirements
- Come up with a controversial (but school appropriate) topic.
- Represent two sides of the argument.
- Cite information supporting both sides.
- Make a final statement/decision. Emphasize this!
- Use clever graphics to represent information (create these in Illustrator).
- Use a color scheme with purpose.
- Use Illustrator techniques, tools and effects.
- Make original artwork only!!!!!
- Cite all sources
No comments:
Post a Comment